SCHEMES FOR ENHANCING THE SATURN V MOON ROCKET’S TRANSLUNAR PAYLOAD CAPABILITY
INTRODUCTION
When I was a teenager struggling to master algebra, geometry, and trigonometry in a tiny little high school in the Bluegrass region of Kentucky, I loved doing mathematical derivations. Those squiggly little math symbols arranged in such neat geometrical patterns on the printed pages held endless fascination for me. But never in my wildest dreams, could I ever have imagined that I might someday be stringing together long, complicated mathematical derivations that would allow enthusiastic American astronauts to hop around on the surface of the moon like gigantic kangaroos. Nor could I have imagined that someday my Technicolor derivations would end up saving more money than a typical American production line worker could earn in a thousand lifetimes of fruitful labor. I was born and raised in a very poor family. My brother once characterized us as “gravel driveway poor”. At age 18 I had never eaten in a restaurant. I had never stayed in a hotel. I had never visited a museum. But, somehow, I managed to work my way through Eastern Kentucky University, one of the most inexpensive colleges in the state. I graduated in 1959 with a major in mathematics and physics eighteen months after the Russians hurled their first Sputnik into outer space. That next summer I accepted a position with Douglas Aircraft in Santa Monica, California, and what a wonderful position that turned out to be! At Douglas Aircraft we were launching one Thor booster rocket into outer space every other week. In 1961 after I earned my Master’s degree in mathematics at the University of Kentucky, I was recruited to work on Project Apollo. And I am convinced that anyone who ever worked on the Apollo Project would tell you that Apollo was the pinnacle of the rocket maker’s art. At age 18 I had never eaten in a restaurant. I had never stayed in a hotel. I had never visited a museum. But somehow, by some miracle, six year later at age 24, I was getting up every day and going to work and helping to put American astronauts on the moon!WHAT IS A MATHEMATICAL DERIVATION?
A mathematical derivation is a series of mathematical and logical steps that starts with something that every expert can agree is true and ends up with a useful conclusion, usually one or more mathematical equations amenable to an easy solution. Hollywood’s version of a mathematical derivation is almost always carried out on big, long blackboards with no words anywhere. But I did all of my derivations with words and in Technicolor – using colored pencils and colored marking pens – on big, oversized quad pads four times as big as a standard sheet of paper. One day when my daughter, Donna, was about five years old, she wandered into my den and watched me struggling over a particularly difficult derivation. “This is embarrassing,” she maintained, “My father colors better than I do.” Most of the derivations my friend, Bob Africano, and I put together in those exciting days centered around our struggles to enhance the performance capabilities of the mighty Saturn V moon rocket. The Saturn V was 365 feet tall. It weighed six million pounds. It generated 7.5 million pounds of thrust and, over nine pulse-pounding Apollo missions, it carried 24 American astronauts into the vicinity of the moon. Twelve of those astronauts walked on the moon’s surface. The other twelve circled around it without landing. Even the simplest mathematical derivation can be difficult, frustrating work and, over the years, we put together hundreds of pages of them. For ten years, and more, we worked 48 to 60 hours per week. We were well paid and treated extremely well and we loved what we were doing for a living. But we were often teetering on the ragged edge of exhaustion. One night at a party I observed that doing mathematical derivations for a living was like “digging ditches with your brain!” In my career I followed the dictum of the British mathematician Bertram Russell. “When you’re young and vigorous, you do mathematics,” he once wrote. “In middle age you do philosophy. And in your dotage, you write novels.” Sad to say, I just finished my first novel! It is intended to become a Hollywood motion picture entitled the 51st State. So this white paper is being composed while I am in my dotage.THOSE CHALLENGING DAYS AT ROCKWELL INTERNATIONAL
I joined the staff of Rockwell International at Downey, California, in 1964. Each morning I would jaywalk across Clark Avenue to get to work in Building 4. I was assigned to a systems engineering group consisting of about 20 engineers and support personnel led by supervisor, Paul Hayes. Paul was proficient in several branches of mathematics and he carefully checked and rechecked the mathematical derivations we were publishing in internal letters, company reports, and in the technical papers we were presenting at big conventions around the country and in a few foreign countries, too. Most of our time and effort was devoted to figuring out how to operate the S-II stage (the second stage of the Saturn V moon rocket) with maximum practical efficiency. We didn’t make any modifications to the hardware; the hardware was already built. Instead, we used the mathematics and the physics we had learned in school, as effectively as possible, to maximize the payload of the mighty Saturn V. Over about ten years on the project, Africano and I – and various others – developed hundreds of pages of useful mathematical derivations. Various other engineers scattered around the country were also trying to figure out how to send more payload to the moon. Joe Jackson, Scott Perrine, and Wayne Deaton at NASA Huntsville, for instance, and Carol Powers and Chuck Leer and their colleagues at TRW in Redondo Beach, California all made significant contributions to this important work. During those early days we were taking mathematics and physics courses at UCLA and UCI (The University of California at Irvine) and teaching courses of our own at the California Museum of Science and Industry, Cerritos College, USC, and at Rockwell International in Downey and Seal Beach, California. Our supervisor, Paul Hayes, showed remarkable patience and leadership when the mathematics (or my own stubbornness) led me down blind alleys. On one occasion, for example, I spent about 3 weeks formulating a more precise family of guidance equations for our six-degree-of-freedom trajectory program. Unfortunately, when those equations were finally finished, checked, and programmed the rocket’s trajectory hardly changed at all. I was rather apologetic, but Paul had an entirely different way of looking at what we were doing for a living. “It’s OK” he told me, softly. “Try something else.” He exhibited the same magnanimous attitude when I insisted on using disk storage to replace the nine magnetic tapes we were using for “scratch-pad” memory. We burned up two weeks or so reprogramming the routines in an attempt to save computer time (which in those days cost $700 per hour!). Unfortunately, as our programmer, Louise Henderson, had predicted, no computer-time saving at all resulted from this tedious and time-consuming effort. Paul Hayes realized that we could not make major breakthroughs in the difficult fields of applied mathematics, orbital mechanics and systems engineering unless we were willing to risk humiliating failures along the way! Fortunately, we did, eventually, perfect four powerful mathematical algorithms that saved an amazing amount of money for the Apollo program. These algorithms, which required no hardware changes and cost virtually nothing to implement, involved at least eight difficult branches of advanced mathematics. In 1969 Bob Africano and I summarized the salient characteristics of these four mathematical algorithms in a technical paper we presented at a meeting of the American Institute of Aeronautics and Astronautics (AIAA) at the Air Force Academy in Colorado Spring, Colorado. It was entitled “Schemes for Enhancing the Performance Capabilities of the Saturn V Moon Rocket.” In that paper we showed how those four mathematical algorithms increased the translunar payload-carrying capabilities of the Saturn V by about 4700 pounds. Measured in 1969 dollars, each pound of that payload was worth $2000, or about 5 times its weight in 24-karat gold. NASA ended up flying nine manned missions around the moon. Consequently, those mathematical algorithms, liberally laced with physics and astrodynamics, ended up saving the American space program $2.5 billion valued in accordance with today’s cost of $1140 for each pound of gold. In the paragraphs to follow, I will attempt to summarize the methods we used to achieve those important payload gains and to describe the mathematical techniques we employed in accentuating the rocket’s performance.PROPELLANT UTILIZATION SYSTEMS
A large liquid-fueled rocket usually includes two separate tanks, one containing the fuel and the other containing the oxidizer. These two fluids are pumped or forced under pressure into the combustion chamber immediately above the exhaust nozzle, where burning of the propellants takes place. If we would load 1000 rockets with the required quantities of fuel and oxidizer, then fly them to their destination orbits, we could expect – due to random statistical variations along the way – to have a small amount of fuel left over on 500 of those flights and a small amount of oxidizer left over on the other 500. Neither the fuel nor the oxidizer can be burned by itself because burning requires a mixture of the two fluids. In order to minimize the average weight of the fuel and oxidizer residuals on the upper stages of the Saturn V rocket, the designers had introduced so-called Propellant Utilization Systems. A Propellant Utilization System employs sensors to monitor the quantities of fuel and oxidizer remaining throughout the flight. It then makes automatic real-time adjustments in the burning-mixture-ratio to achieve nearly simultaneous depletion of the two fluids when the rocket burns out. For the Saturn V, the necessary measurements were made with capacitance probes running along the length of the fuel tank and the oxidizer tank. A capacitance probe is a slender rod encased within a hollow cylinder. Openings at the bottom of the hollow cylinder allow the fluid level on the inside of it to duplicate its level on the outside. As the fluid level inside the cylinder decreases, the electrical capacitance of the circuit changes to provide a direct measure of the amount of fluid remaining in the tank. These continuous fluid-level measurements are then used in making small real-time adjustments in the rocket’s burning-mixture-ratio to achieve nearly simultaneous depletion of the two propulsive fluids.THE PROGRAMMED MIXTURE RATIO SCHEME
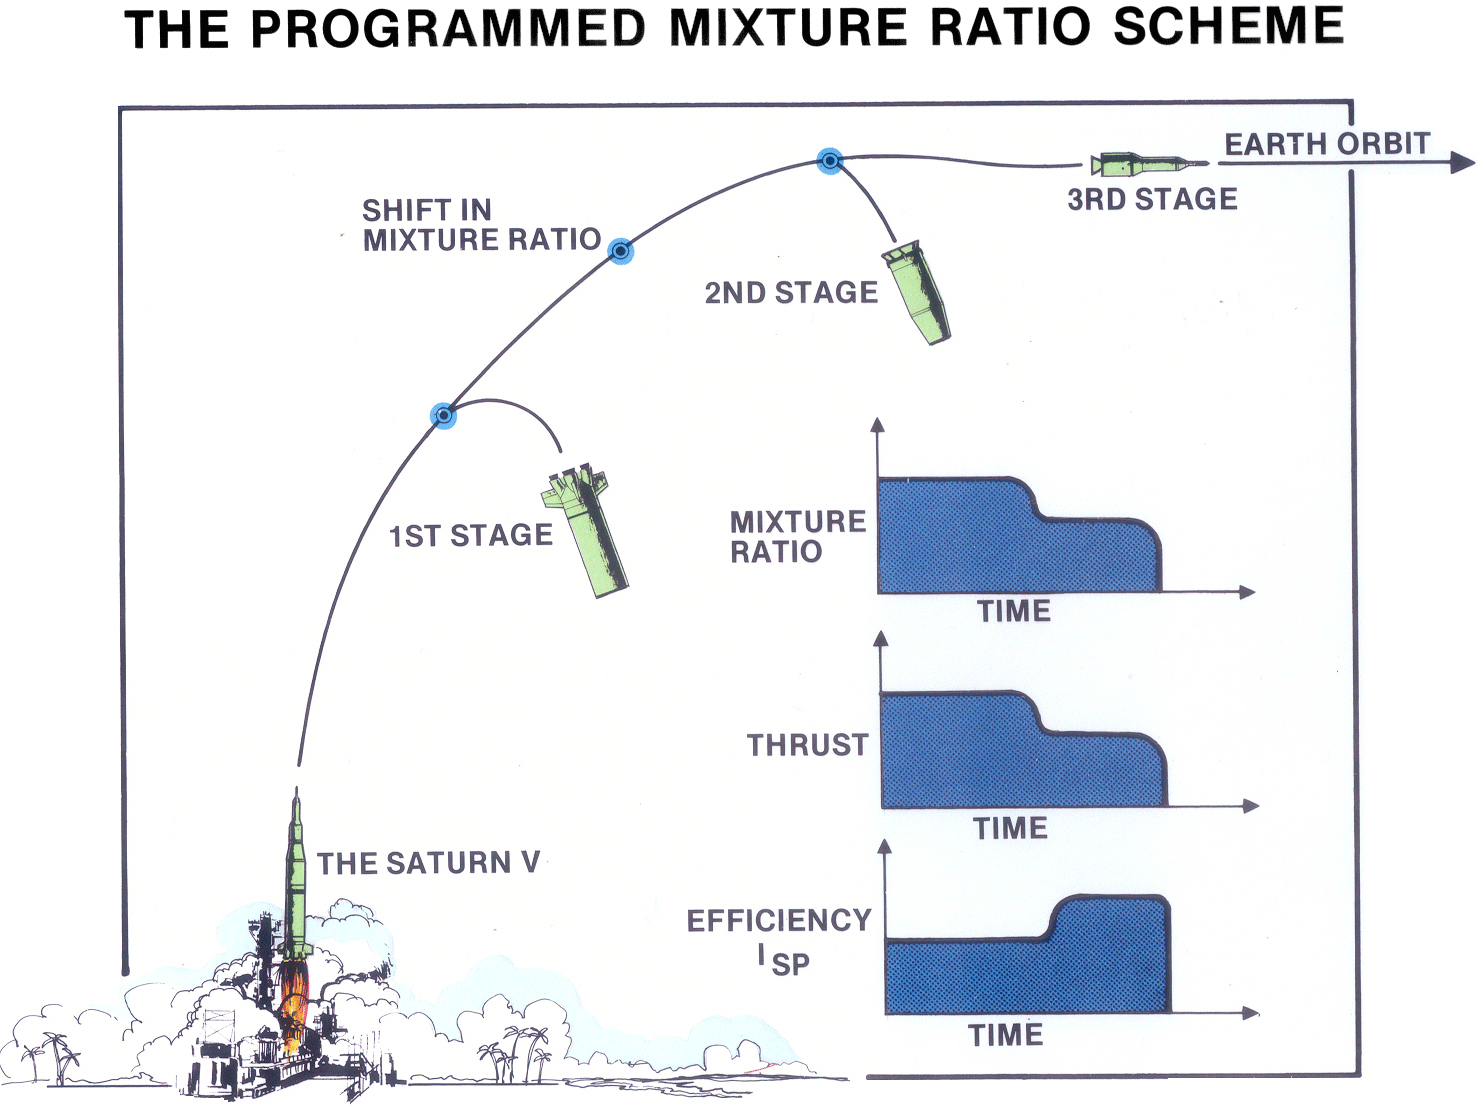
The Propellant Utilization System on the S-II stage increased the performance of the booster by an extra 1400 `pounds of payload headed toward the moon. Unfortunately, modeling the behavior of the propellant utilization systems in flight created a complicated problem for the mission planning engineers. When we were simulating the translunar trajectories and the corresponding payload capabilities for the Saturn V, we found that, if we ran two successive simulations with identical inputs, each simulation would yield a slightly different payload at burnout. These rather unexpected payload variations came about because the computer program’s subroutines automatically simulated slightly different statistical variations in the Propellant Utilization System during each flight. In order to circumvent this difficulty, we did what engineers almost always do – we called a meeting. And at that meeting we brainstormed various techniques for making those pesky payload variations go away. Fortunately, no one in attendance that day was able to come up with a workable solution. Sitting in the back of the room was long, lanky propulsion specialist named Bud Brux. who said almost nothing during the meeting. But, when Bud Brux got back to his office, he began thinking about the problem we had encountered. “Hey, wait a minute!” he thought, “The reason we build a rocket is to put payload into space. If something is causing that payload to vary, maybe we should try to accentuate the effect, rather than trying to make it go away.” Bud Brux then wrote us a simple, two-page internal letter suggesting that we vary the mixture ratio as much as we possible in a few of our computer simulations to see if we could produce important performance gains. We were not particularly excited by the letter he wrote; we received lots of internal letters in those days. But, when those first few trajectory simulations came back from the computer, our excitement shot up by a decibel or two. On the best of those simulations, the Saturn V moon rocket was able to carry nearly 2700 extra pounds of payload to the moon, each pound of which was worth $2000 – or five times its weight in 24-karat gold.
OPTIMAL FUEL BIASING
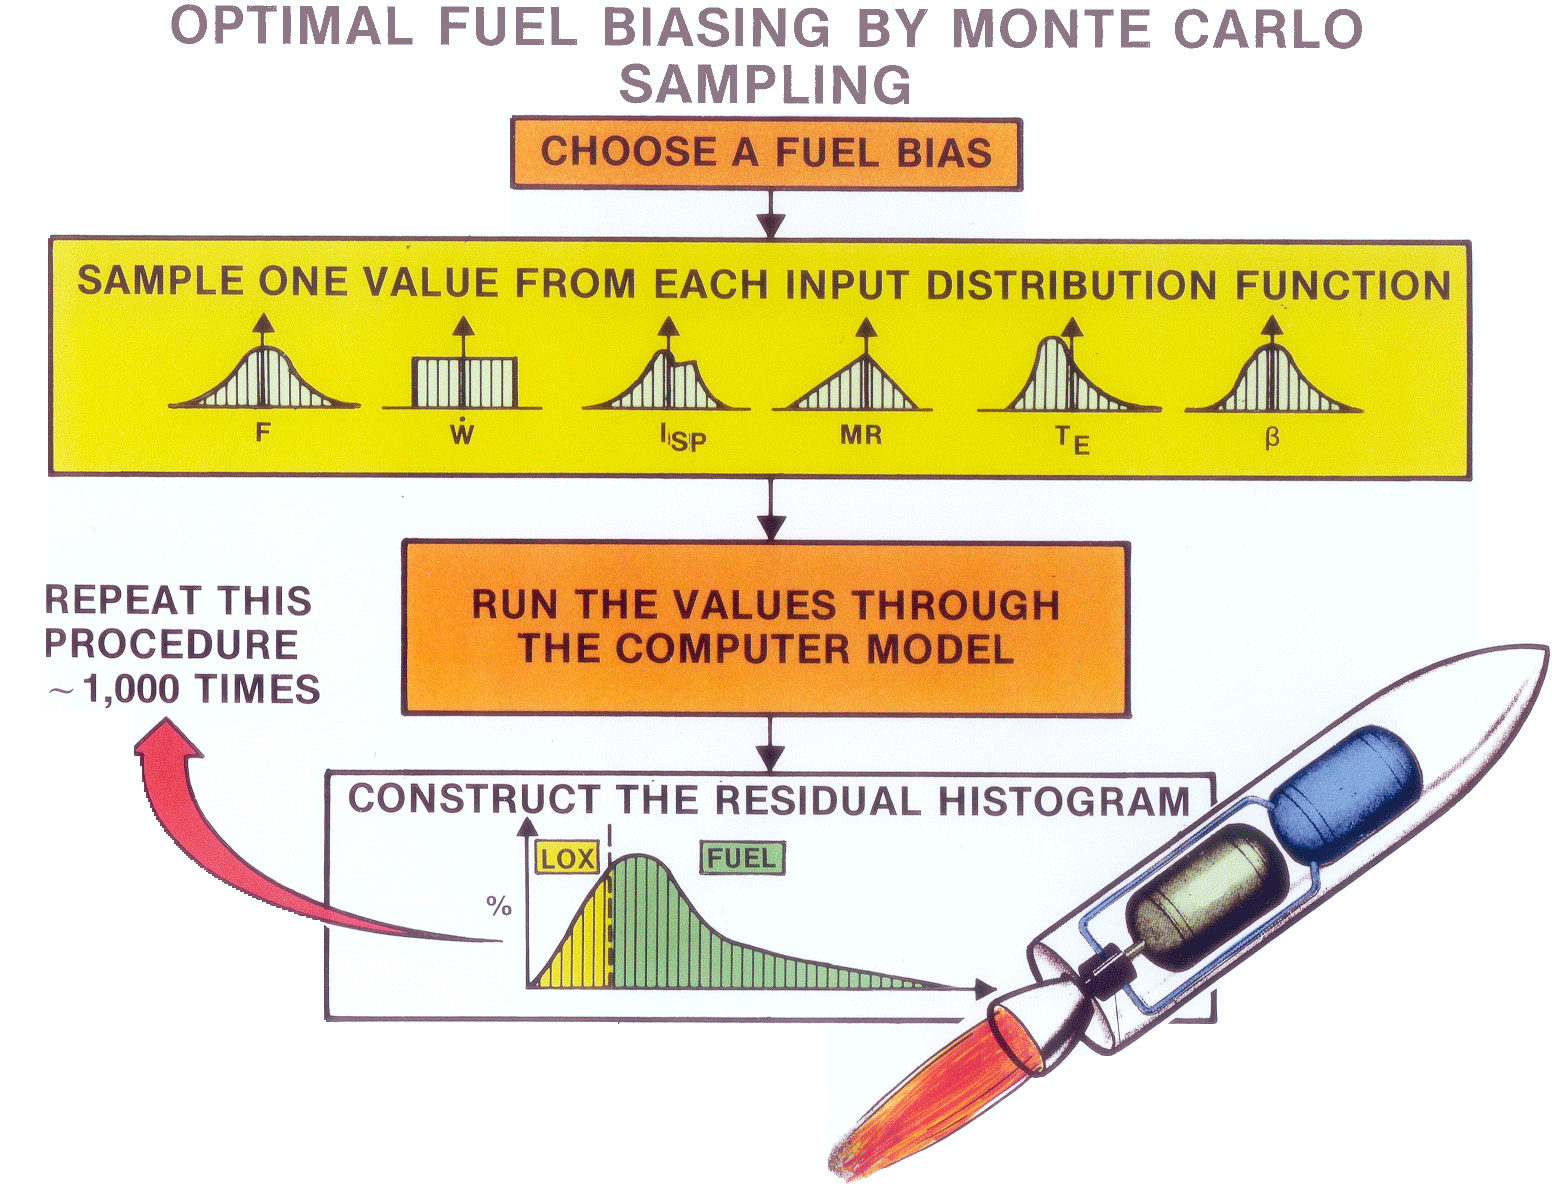
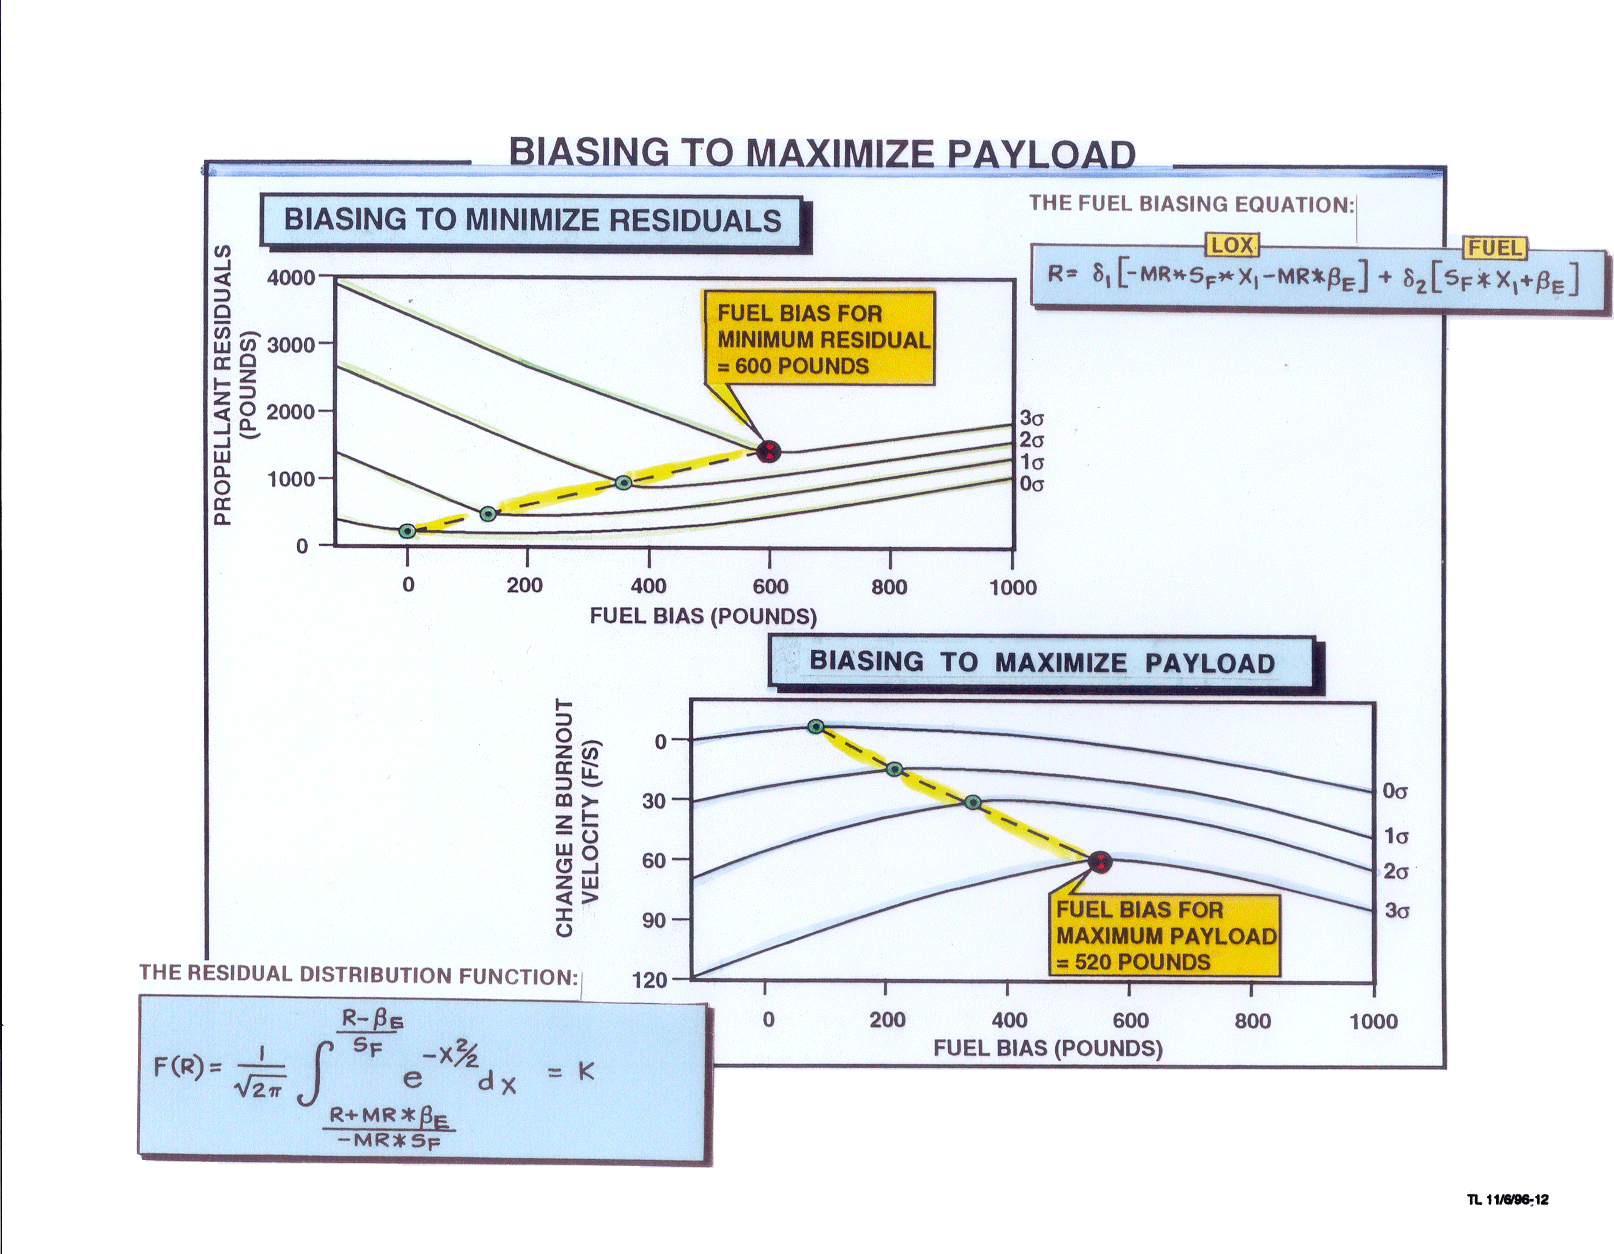
If we load 1000 identical hydrogen-oxygen rockets with the desired amounts of fuel and oxidizer in the proper ratio and then fly all 1000 of them into earth orbit along 1000 statistically varying trajectories, approximately 500 of them will end up with fuel residuals at burnout, and the other 500 will end up with oxidizer residuals. Moreover, on the average, the 500 oxidizer residuals will turn out to be approximately five times heavier than the 500 fuel residuals because a typical hydrogen-oxygen rocket carries five pounds of oxidizer for every pound of fuel. Consequently, if we would add a little extra fuel to each of those 1000 rockets before lift-off, that extra fuel would reduce the statistical frequency of the heavier oxidizer residuals. Moreover, the few remaining oxidizer residuals that do occur will be lighter because of the fuel bias we have added. In practice, however, figuring out precisely how much extra fuel to add to achieve optimal mission performance turned out to be a difficult and expensive problem in statistics. Our first approach toward determining the optimal fuel bias is flowcharted in Figure 3. In each of our simulations we command the computer to choose a fuel bias and then sample a series of statistically varying values having to do with the variation of the rocket’s thrust, its flow rate, its specific impulse, its mixture ratio, and so on. The computer then substituted each of these statistical values into our optimal trajectory simulation program, and at burnout, it recorded the type of residual (fuel or oxidizer) and its corresponding weight. This so-called “Monte Carlo” simulation procedure was repeated hundreds or thousands of times to allow the computer to construct an accurate statistical “snapshot” similar to the one sketched at the bottom of Figure 2. Repetitions of those computerized procedures executed with different fuel-bias levels allowed us to determine the fuel bias that provided the optimum rocket performance. This technique worked as advertised, but it turned out to be extremely costly, in the days when computer simulation time was so incredibly expensive. However, after several hours of mind-bending mathematical manipulations, I managed to reduce the essence of the optimization problem we faced to a single mathematical equation. It was an integral equation from calculus with variable limits of integration based on the normal distribution functions from the statistics courses I had been attending at UCLA.

POSTFLIGHT TRAJECTORY RECONSTRUCTION
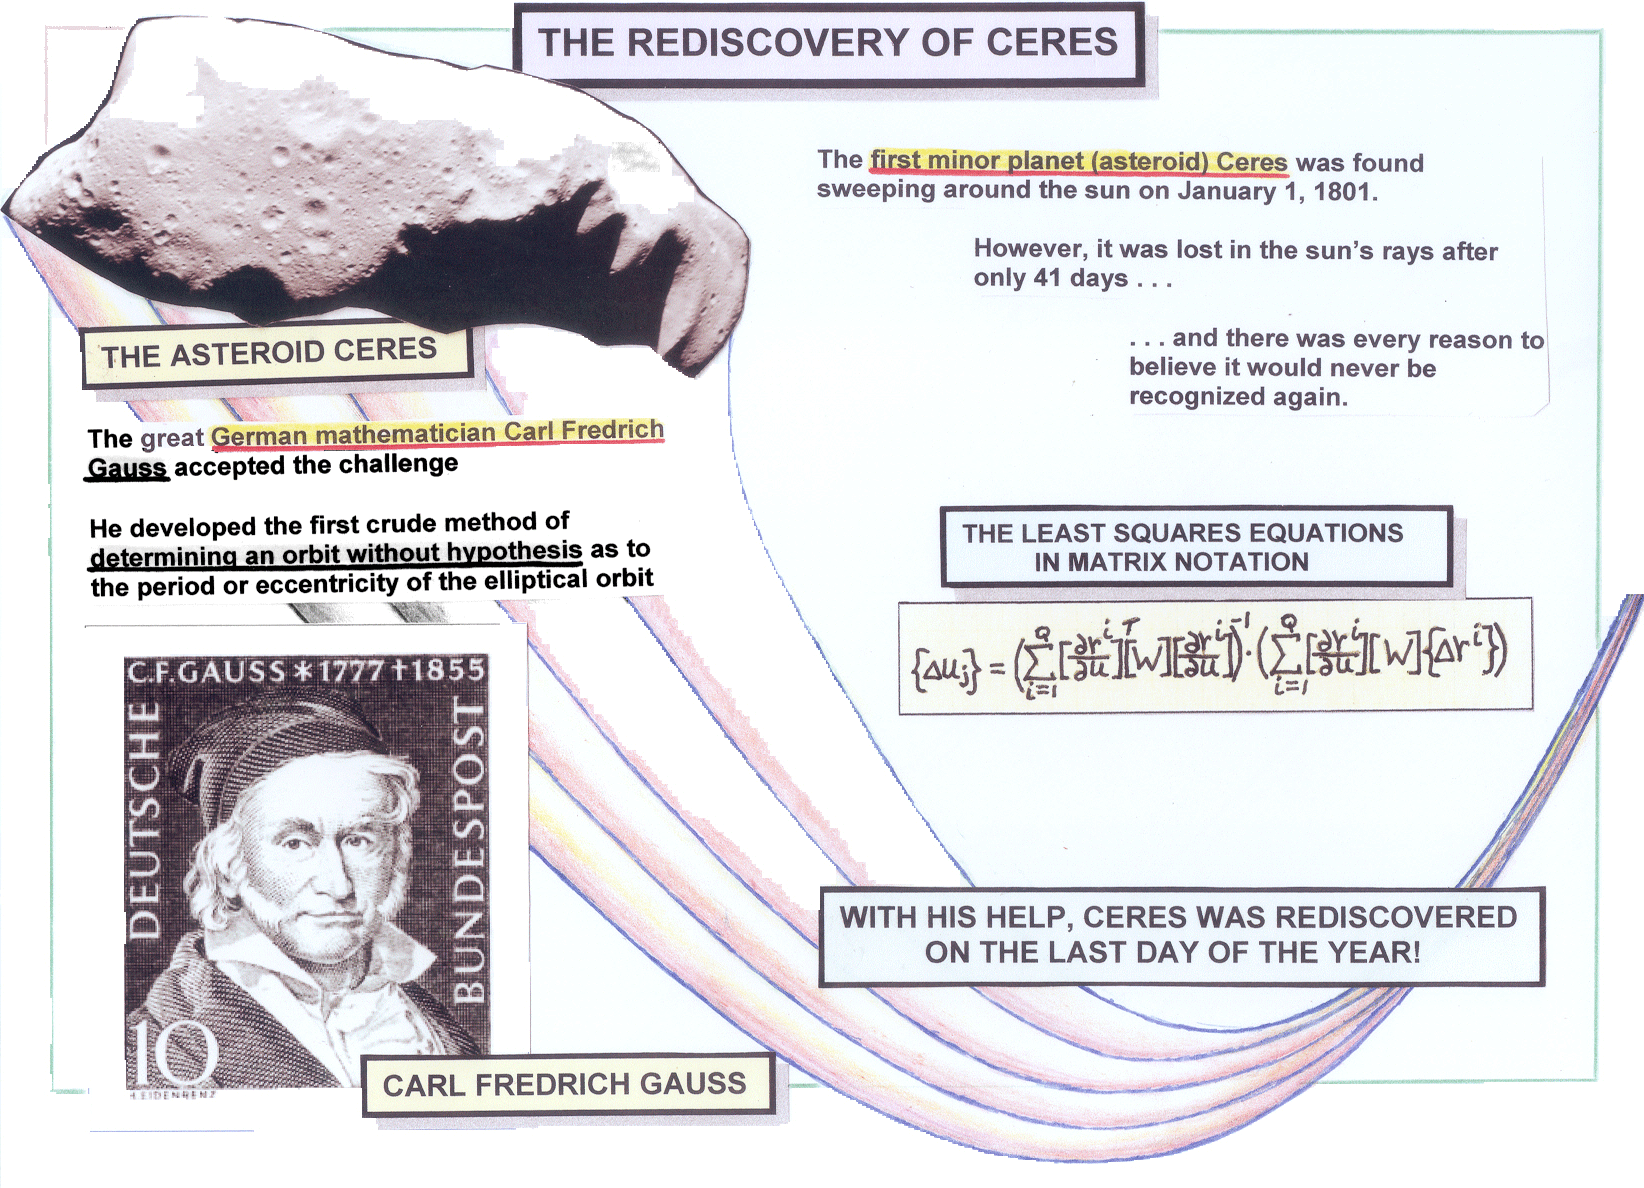
On January 1, 1801, the first minor planet, Ceres, was spotted by alert telescope-equipped astronomers as it hooked around the sun. Ceres, which we now call an asteroid, was a new type of object never seen by anyone on Earth up until that time. Unfortunately, after Ceres had been in view for only 41 days, it traveled so close to the harsh rays of the sun it was lost from view. The astronomers who were tracking it were afraid that it might never be found again. However, as Figure 4 indicates, the famous German mathematician Carl Frederich Gauss accepted the challenge of trying to reconstruct the trajectory of Ceres from the small number of closely spaced astronomical observations available to him. Under his brilliant direction, Ceres was located again on the other side of the Sun on the last day of 1801, almost exactly one year after it had first been discovered.* More than 160 years later in 1962, we adapted the mathematical methods Gauss had used in reconstructing the orbit of Ceres to determine the performance of the Saturn V moon rocket on a typical mission. When we were executing a preflight trajectory simulation, we would feed the thrust and flow-rate profiles into the program together with the initial weight of the vehicle, its guidance angle histories, and the like, and then we would simulate the resulting trajectory of the rocket. In a postflight trajectory simulation, we did exactly the opposite. We would feed the program the trajectory of the ______________ * When Gauss was in elementary school in Germany, one of his teachers asked her students to “add up all the values of the 100 integers ranging from 1 to 100.” While his classmates were struggling to obtain the solution, the young Gauss wrote down the answer immediately. He had noticed that there were 50 pairs of numbers – each of which totaled 101; they were 1 + 100, 99 + 2, 98 + 3 . . and so the desired total was equal to 50 (101) = 5050. rocket – as ascertained by the tracking and telemetry measurements – and then we would use the computer to determine the thrust and flow-rate profiles and the guidance angles the booster must have had in order to have traveled along the observed trajectory.
THE LEGACY
Today virtually every large liquid rocket that flies into space takes advantage of the performance-enhancement techniques we pioneered in conjunction with the Apollo moon flights. NASA’s reusable space shuttle, for example, employs modern versions of optimal fuel biasing and postflight trajectory reconstruction. However, more of the critical steps are accomplished automatically by the computer. Russia’s huge tripropellant rocket, which was designed to burn kerosene-oxygen early in its flight, the switch to hydrogen-oxygen for the last part, yields important performance gains for precisely the same reason the Programmed Mixture Ratio scheme did. In short, the fundamental ideas we pioneered are still providing a rich legacy for today’s mathematicians and rocket scientists most of whom have no idea how it all crystallized more that 40 years ago.THE CONCLUSION
Figure 5 summarizes the performance gains and a sampling of the mathematical procedures we used in figuring out how to send 4700 extra pounds of payload to the moon on each of the manned Apollo missions. We achieved these performance gains by using a number of advanced mathematical techniques, nine of which are listed on the chart. No costly hardware changes were necessary. We did it all with pure mathematics! In those days each pound of payload was estimated to be worth five times its weight in 24-karat gold. As the calculations in the box in the lower right-hand corner of Figure 5 indicate, the total saving per mission amounted to $280 million, measured in 2009 dollars. And, since we flew nine manned missions from the earth to the moon, the total savings amounted to $2.5 billion in today’s purchasing power! We achieved these savings by using advanced calculus, partial differential equations, numerical analysis, Newtonian mechanics, probability and statistics, the calculus of variations, non linear least squares hunting procedures, and matrix algebra. These were the same branches of mathematics that had confused us, separately and together, only a few years earlier at Eastern Kentucky University, the University of Kentucky, UCLA, and USC. I was born and raised in a very poor family. At age 18 I had never eaten in a restaurant. I had never stayed in a hotel. I had never visited a museum. But somehow, by some miracle, six years later, at age 24, I was getting up every day and going to work and helping to put American astronauts on the moon! Even as a teenager I loved doing mathematical derivations. Those squiggly little math symbols arranged in such neat geometrical patterns were endlessly fascinating to me. But never in my wildest dreams, could I ever have imagined that someday I might be stringing together long, complicated mathematical derivations that would allow enthusiastic American astronauts to hop around on the surface on the moon like gigantic kangaroos! Nor could I have ever imagined that someday my Technicolor derivations would end up saving more money than a typical American production line worker could earn in a thousand lifetimes of fruitful labor!
BIBLIOGRAPHY
- Logsdon, Tom. Orbital Mechanics: Theory and Applications. John Wiley and Sons. New York, N.Y. 1998.
- Logsdon, Tom. The Rush Toward the Stars. Franklin Publishing Co. Palisade, New Jersey, 1970. Also published by Wm. C. Browne (paperback). Dubuque, Iowa. 1969.
- Logsdon, Tom. Mobile Communication Satellites: Theory and Applications. McGraw Hill. New York, N.Y. 1995. Also published by McGraw Hill (paperback). Singapore. 1995.
- Logsdon, Tom. Six, Simple, Creative Solutions That Shook the World. nine Seas Publishing Co. Seal Beach, CA. 1993. Also published by Addison Wesley Publishing Co. (paperback) under the title Breaking Through. 1993.
- Africano, R.C. and T.S. Logsdon. Schemes for Enhancing the Saturn V Translunar Payload Capability. AIAA 5th Propulsion Joint Specialist Conference. U.S. Air Force Academy, Colorado. June 9-13, 1969.
- Logsdon, T.S. and R.C. Africano. An Alternative to Monte Carlo. AIAA reprint No. G7-210 presented to AIAA 5th Aerospace Science Meeting. New York, N.Y. January 3, 1967. Also published under the title A Modified Monte Carlo Procedure. AIAA Journal. Volume 6. No. 6. June 1968. pp. 111-117.
- Jackson, J. Propulsion System Evaluations Through Flight Simulation. Marshall Space Flight Center. Huntsville, Alabama. August 31, 1962.
- Powers, C.S. Precision Determination of Vacuum Specific Impulse from Trajectory Data. Presented to the AIAA 5th Symposium on Ballistic Missile and Space Technology. May, 1960.
- Lear, C.W. A Summary of Equations for the Minuteman Propulsion Best Estimate Program (BEEP). Space Technology Laboratories, Inc. 9732. 6-63-5. January, 1963.